Every project, written up end to end.
Dashboards, pipelines and automation delivered for sales, operations and finance teams — the brief, the build, the numbers that moved. Filter by tool, or search for the problem you are trying to solve.
- 9 projects shown
- 9 organisations
- 2024–2026 delivery window
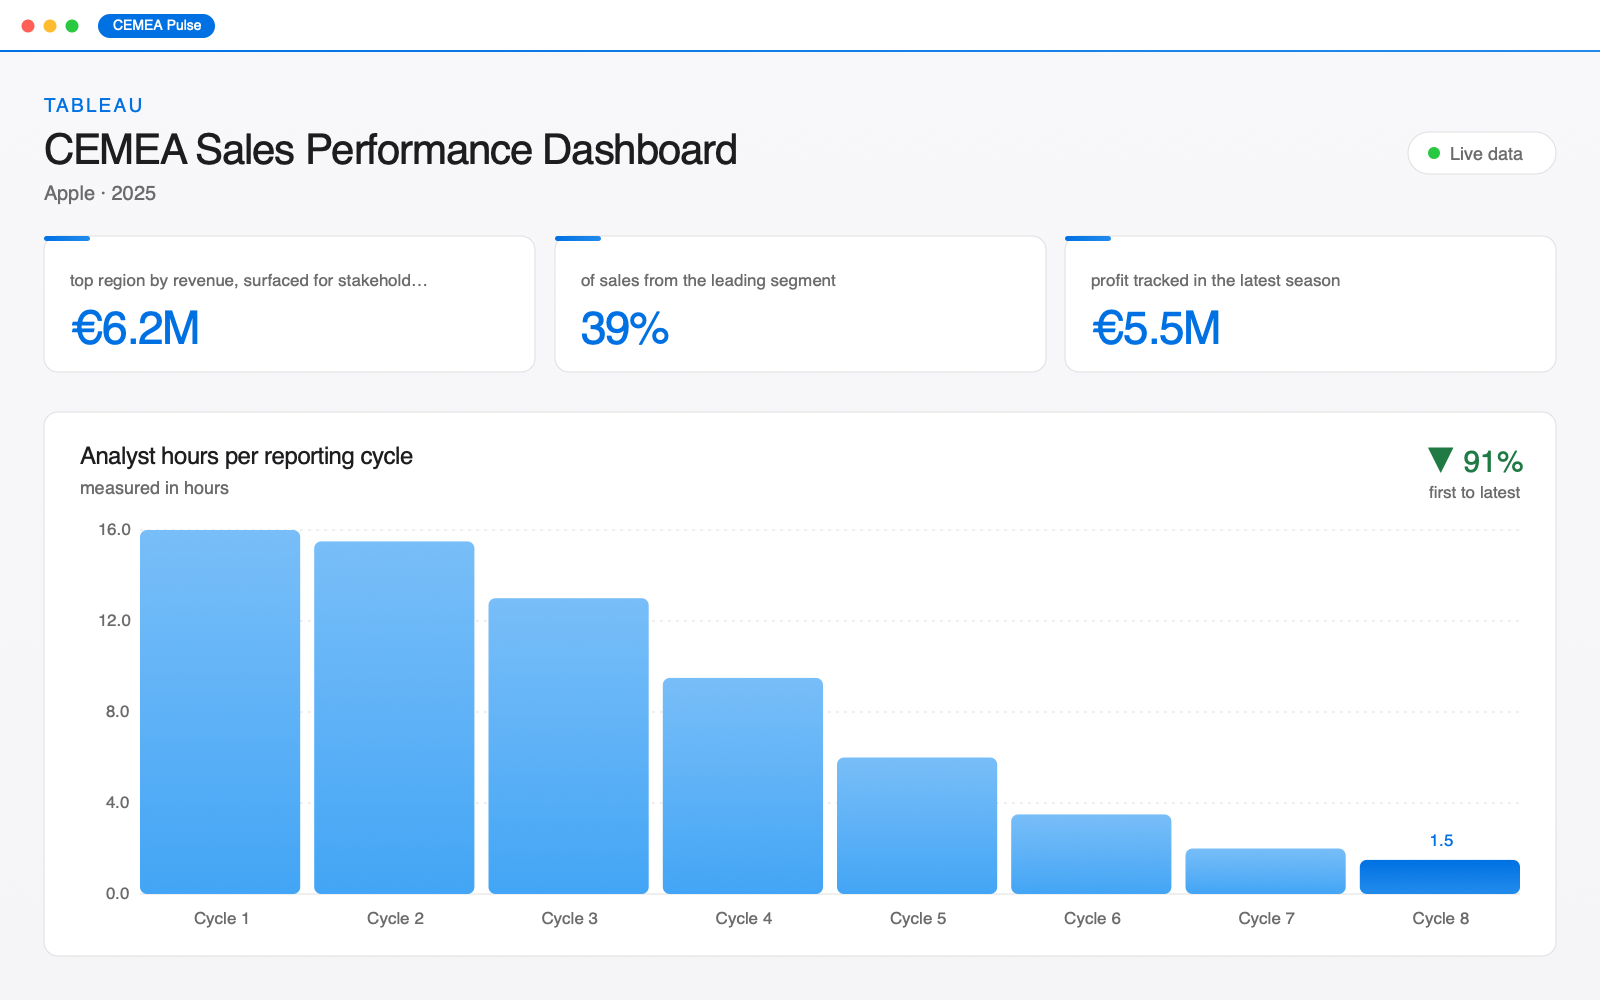 CEMEA Pulse
 CEMEA Sales Performance Dashboard
Region-wide sales visibility for Apple’s CEMEA Sales BPR & Systems team — one Tableau model replacing a fortnightly spreadsheet pack.
- top region by revenue, surfaced for stakeholders
- €6.2M
- of sales from the leading segment
- 39%
- profit tracked in the latest season
- €5.5M
- Tableau
- SQL
- Google BigQuery
- Python (Pandas, Playwright)
- Microsoft Excel
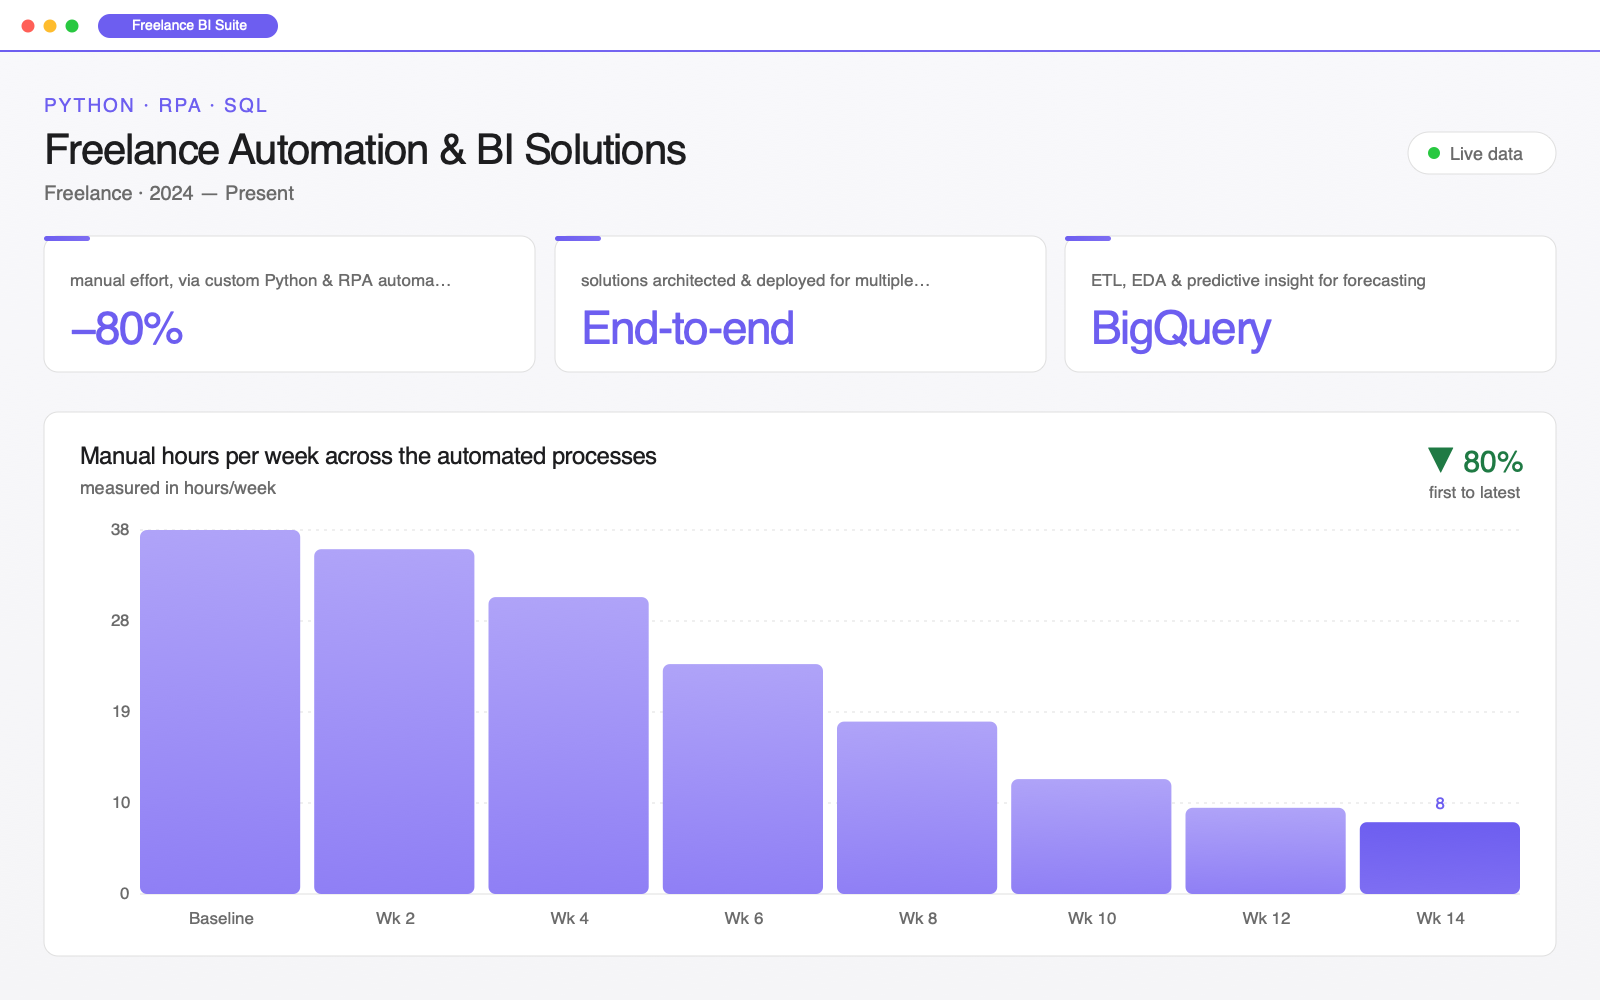 Freelance BI Suite
 Freelance Automation & BI Solutions
End-to-end data and automation delivery for small European teams — from first consultation to a deployed pipeline they own.
- manual effort, via custom Python & RPA automation
- −80%
- solutions architected & deployed for multiple clients
- End-to-end
- ETL, EDA & predictive insight for forecasting
- BigQuery
- Python (Pandas, Playwright, Selenium)
- SQL
- Google BigQuery
- Power BI
- n8n
- Git
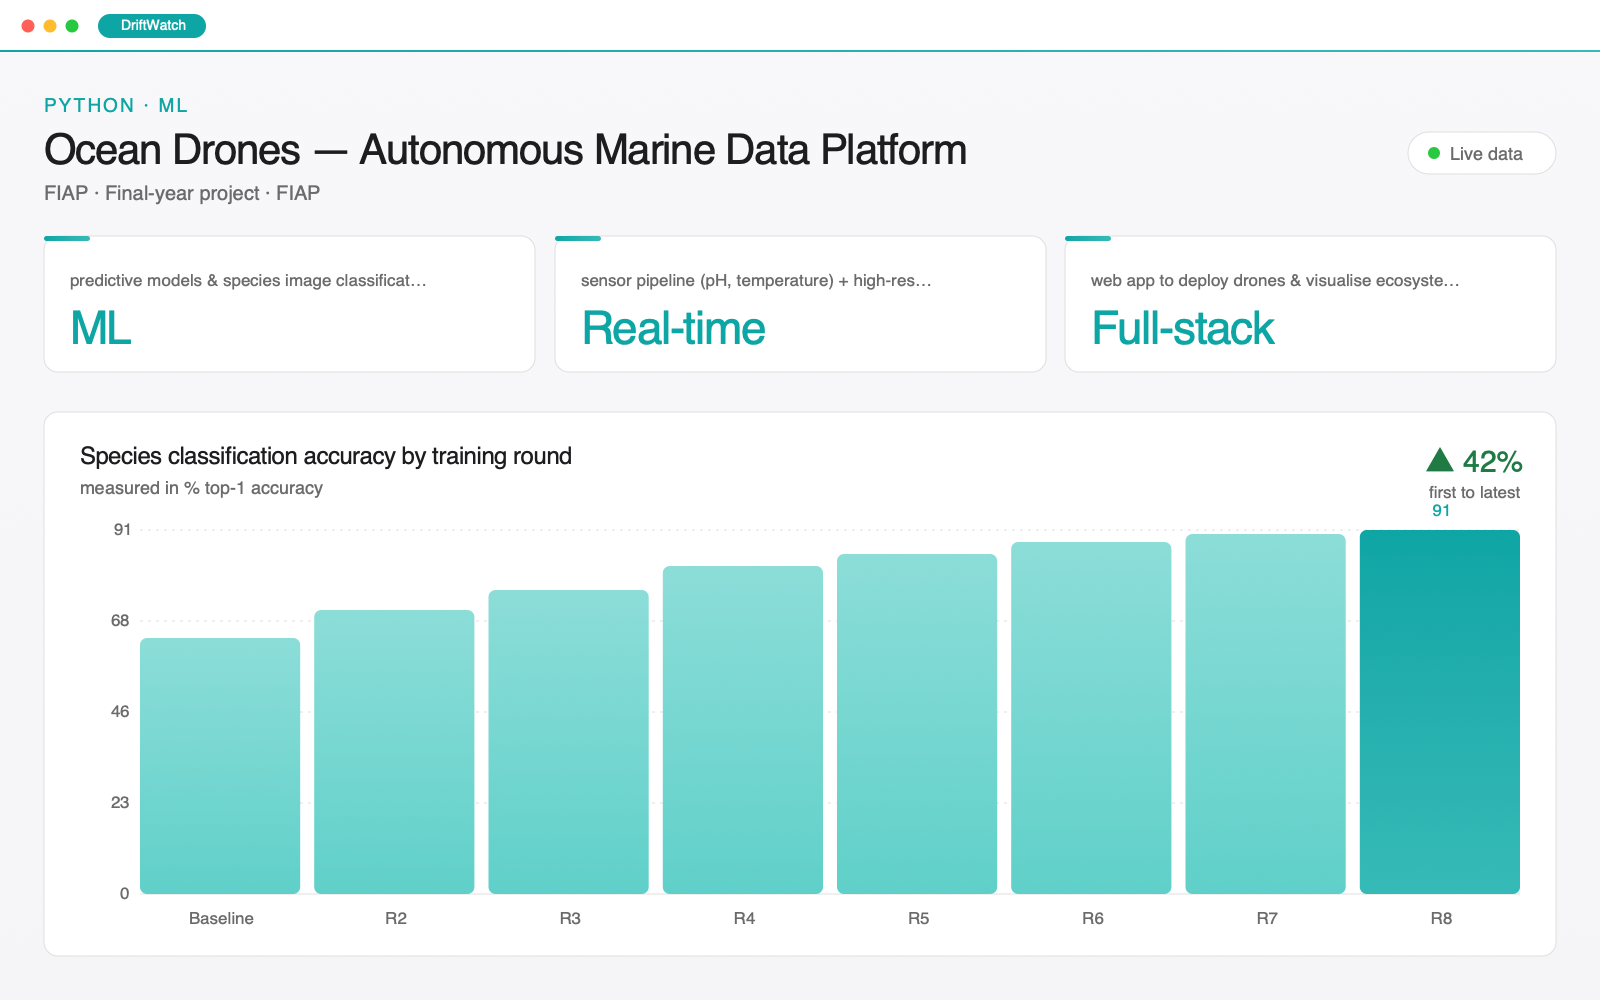 DriftWatch
 Ocean Drones — Autonomous Marine Data Platform
A full-stack platform that deploys autonomous marine drones, streams their sensor telemetry and classifies the species they photograph.
- predictive models & species image classification (Scikit-learn, TensorFlow)
- ML
- sensor pipeline (pH, temperature) + high-res imagery
- Real-time
- web app to deploy drones & visualise ecosystem health
- Full-stack
- Python
- Scikit-learn
- TensorFlow
- FastAPI
- PostgreSQL
- JavaScript
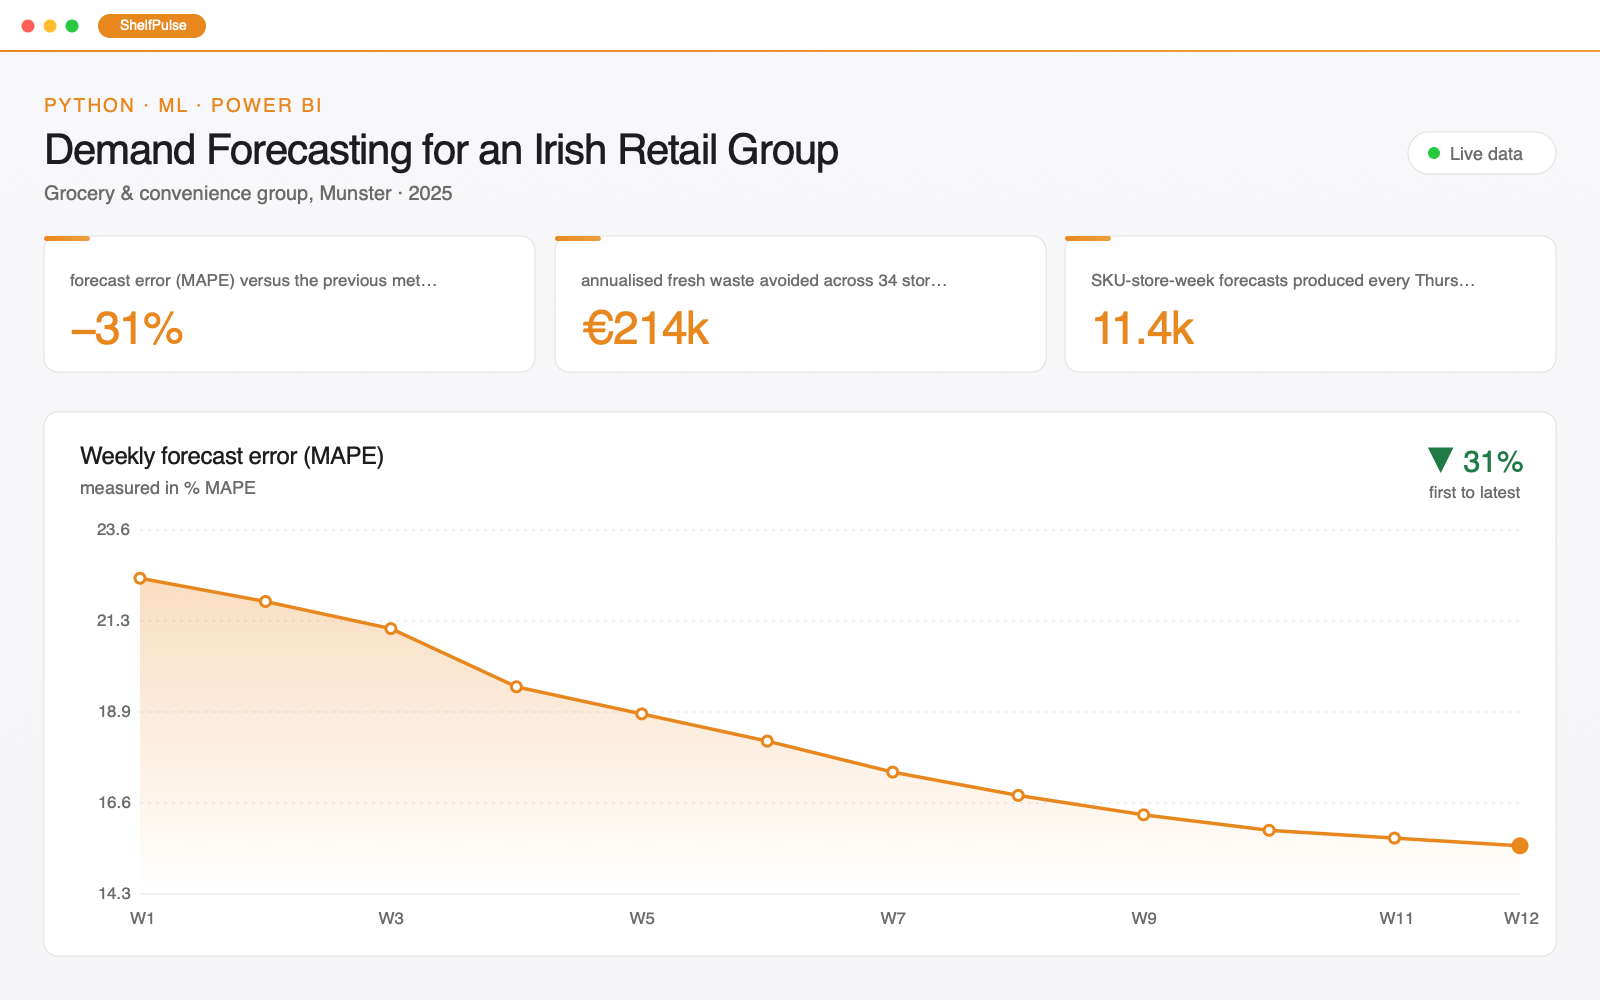 ShelfPulse
 Demand Forecasting for an Irish Retail Group
SKU-level weekly forecasting across 34 stores, replacing a spreadsheet that ordered on last year’s numbers plus a feeling.
- forecast error (MAPE) versus the previous method
- −31%
- annualised fresh waste avoided across 34 stores
- €214k
- SKU-store-week forecasts produced every Thursday
- 11.4k
- Python (Pandas, scikit-learn, LightGBM)
- SQL
- Power BI
- Azure Blob Storage
- Excel
 ChurnRadar
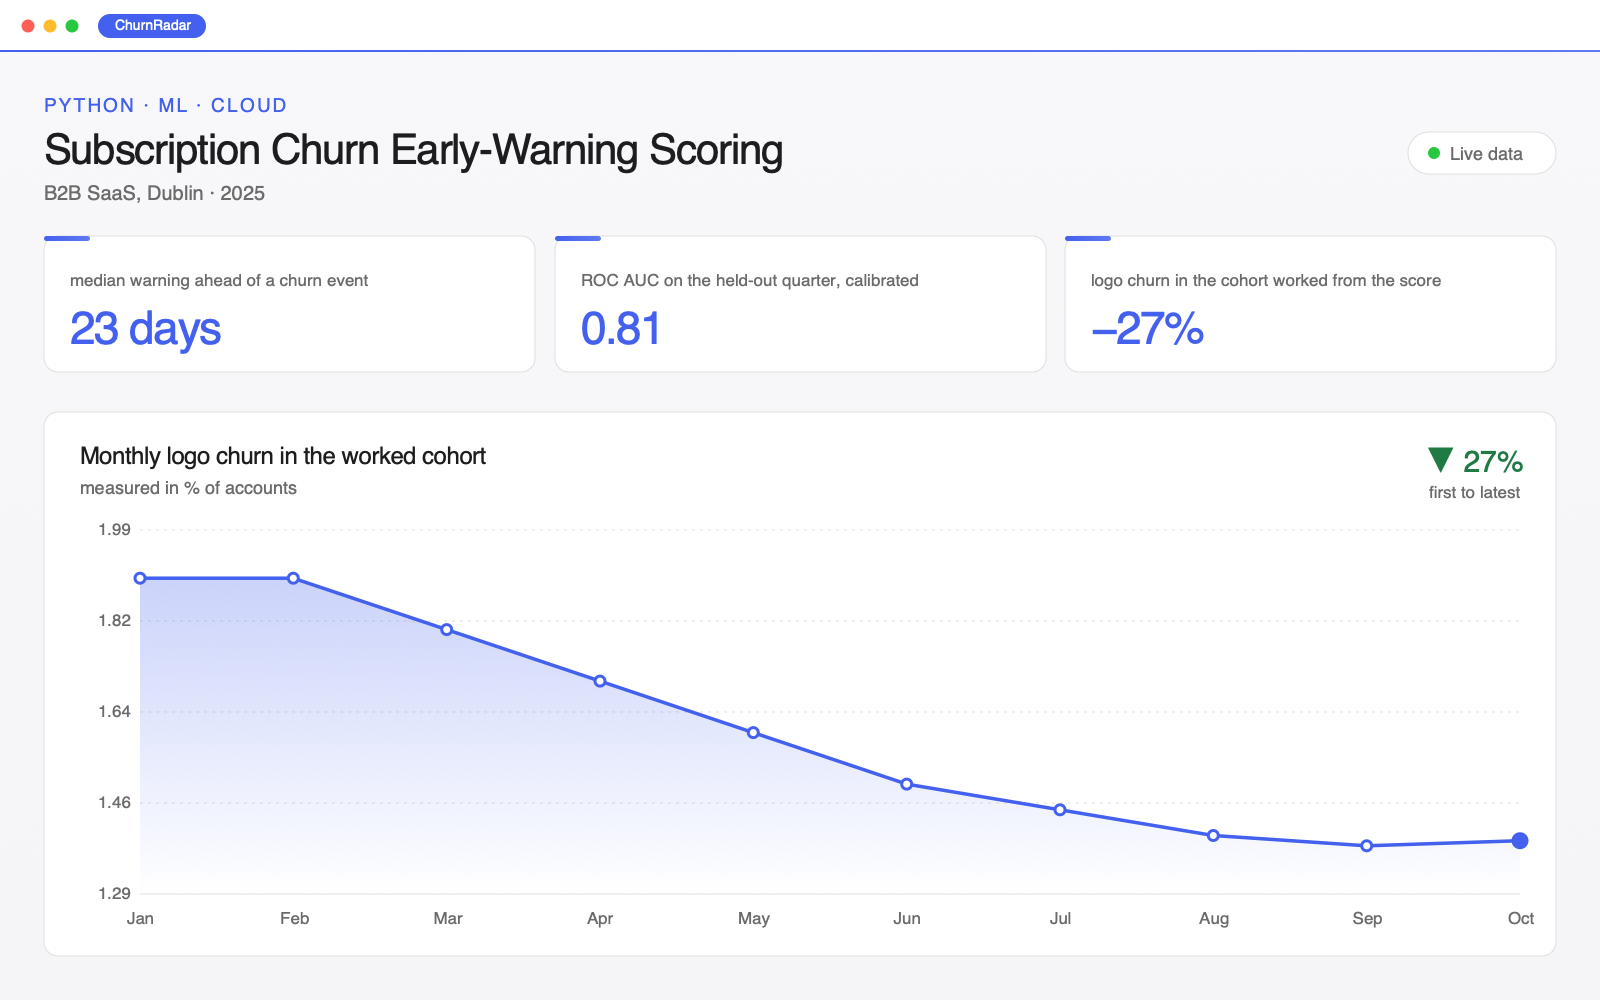
 Subscription Churn Early-Warning Scoring
A daily churn score for 8,400 B2B accounts that gives customer success three weeks of warning instead of a renewal-week surprise.
- median warning ahead of a churn event
- 23 days
- ROC AUC on the held-out quarter, calibrated
- 0.81
- logo churn in the cohort worked from the score
- −27%
- Python (Pandas, scikit-learn, XGBoost)
- BigQuery
- Cloud Run
- dbt
- Looker Studio
 CloseFlow
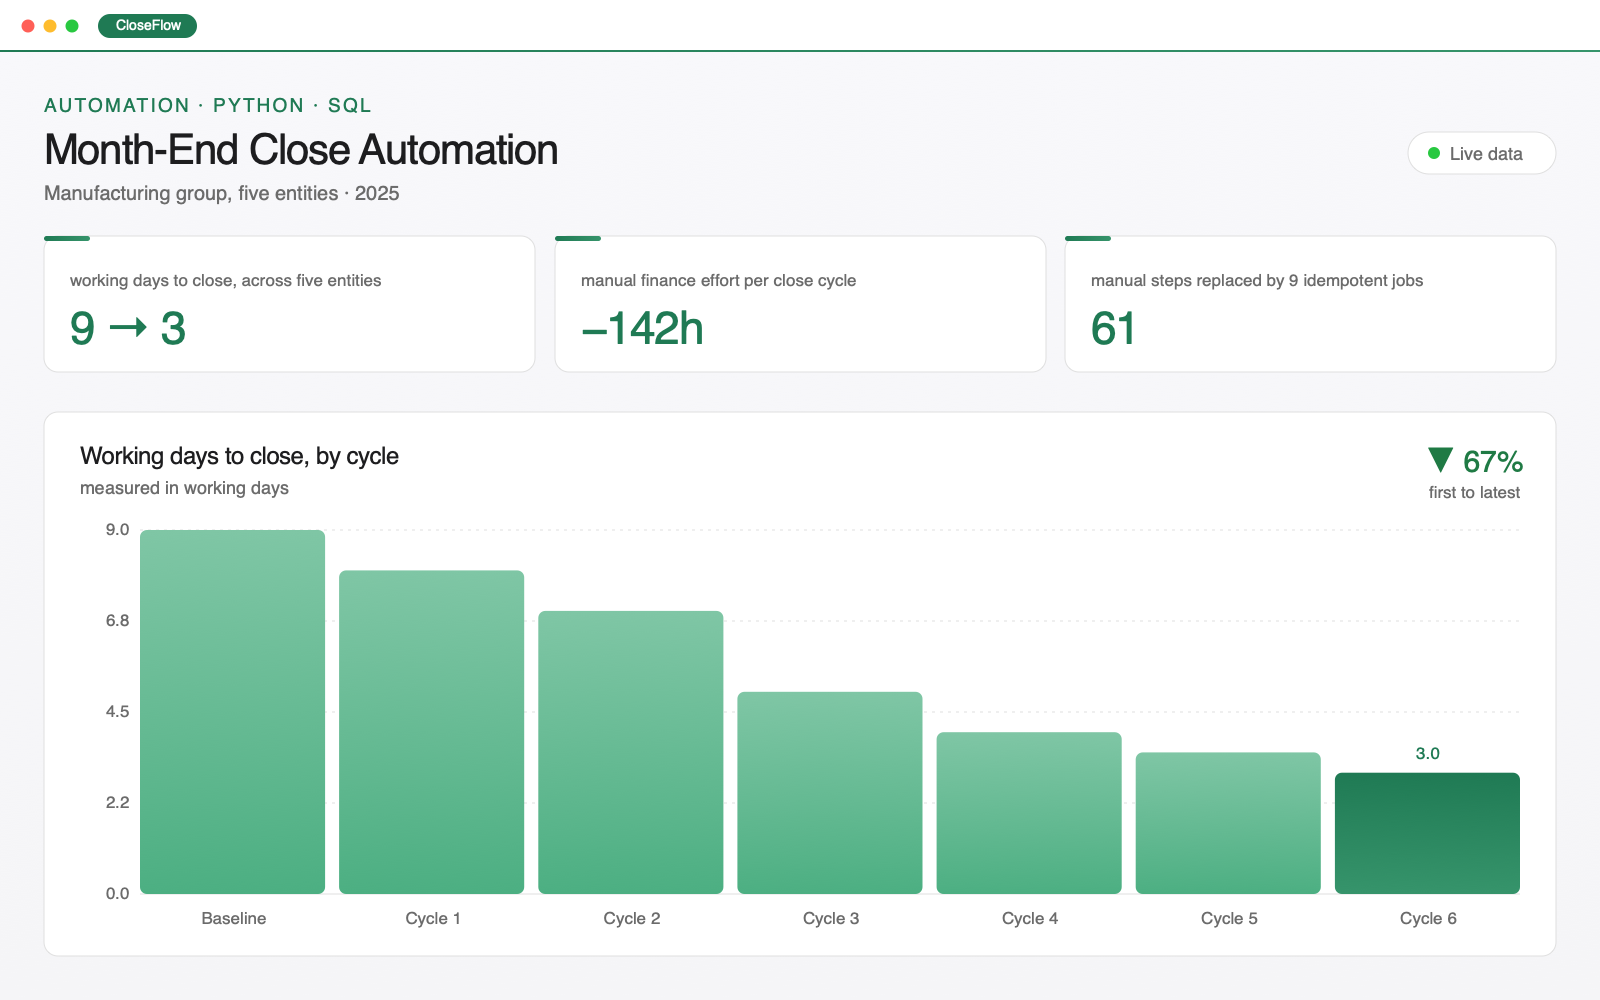
 Month-End Close Automation
A nine-day month-end close cut to three, by automating the reconciliation and consolidation steps rather than asking people to work faster.
- working days to close, across five entities
- 9 → 3
- manual finance effort per close cycle
- −142h
- manual steps replaced by 9 idempotent jobs
- 61
- Python (Pandas, openpyxl)
- SQL Server
- Excel
- Power Automate
- Git
 RouteWatch
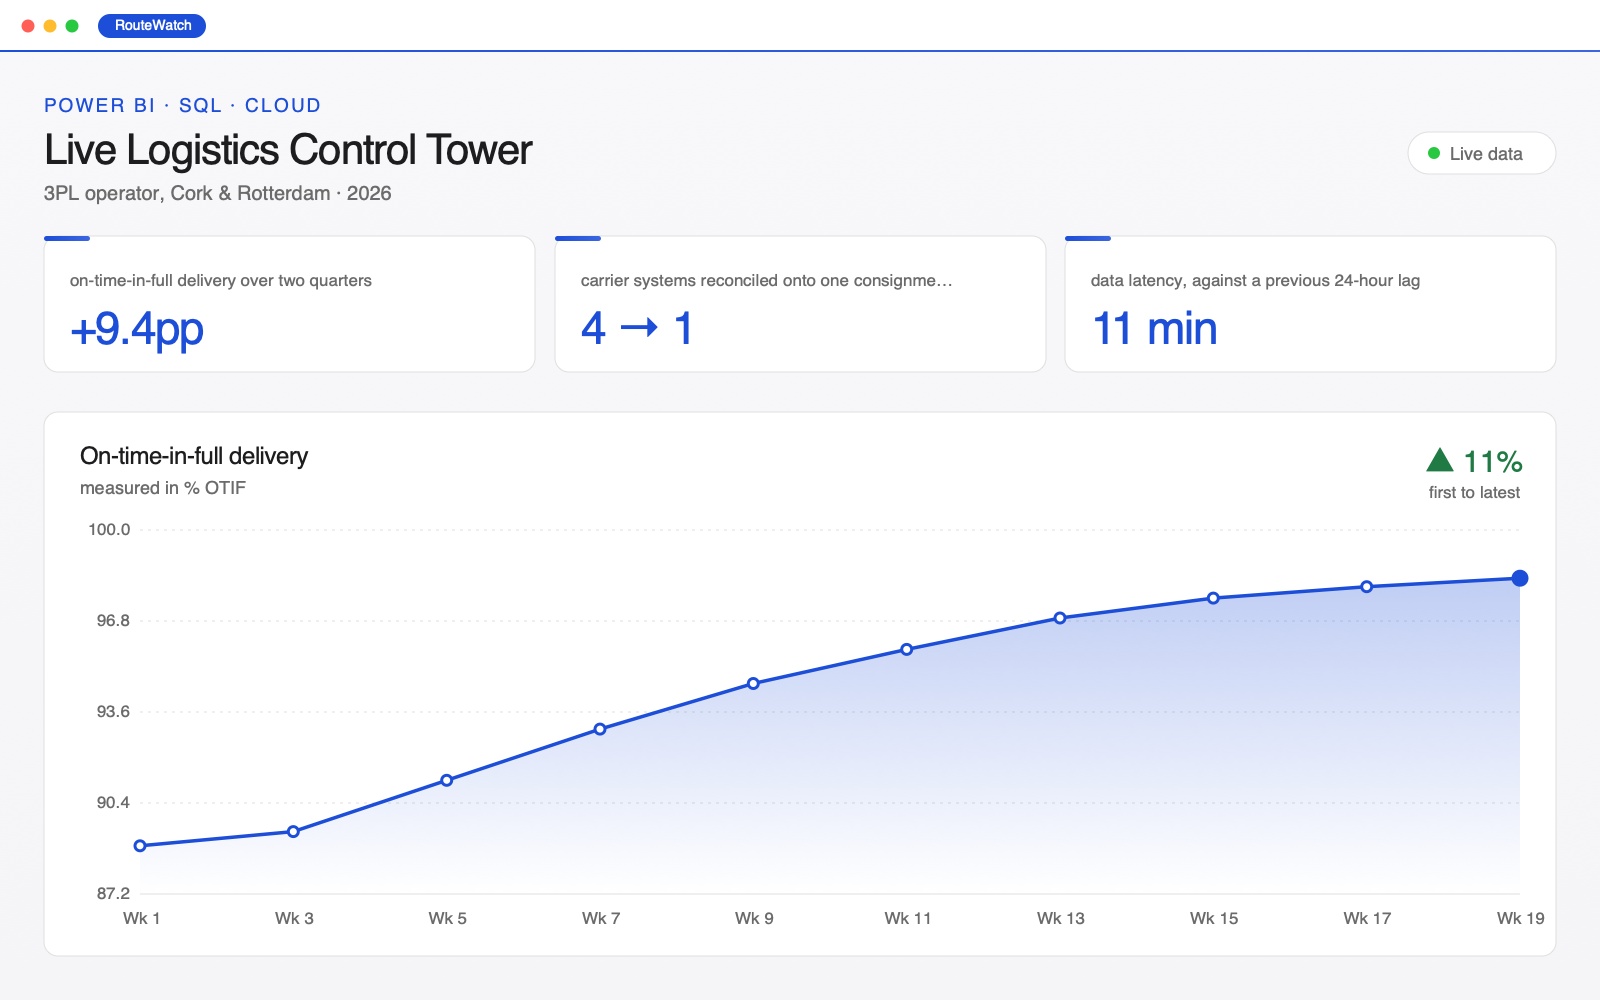
 Live Logistics Control Tower
One live view across four carriers and two hubs, so a delayed consignment is a phone call the same morning instead of a claim three weeks later.
- on-time-in-full delivery over two quarters
- +9.4pp
- carrier systems reconciled onto one consignment spine
- 4 → 1
- data latency, against a previous 24-hour lag
- 11 min
- Power BI
- SQL Server
- Azure Data Factory
- Azure SQL
- Python
 TriageLens
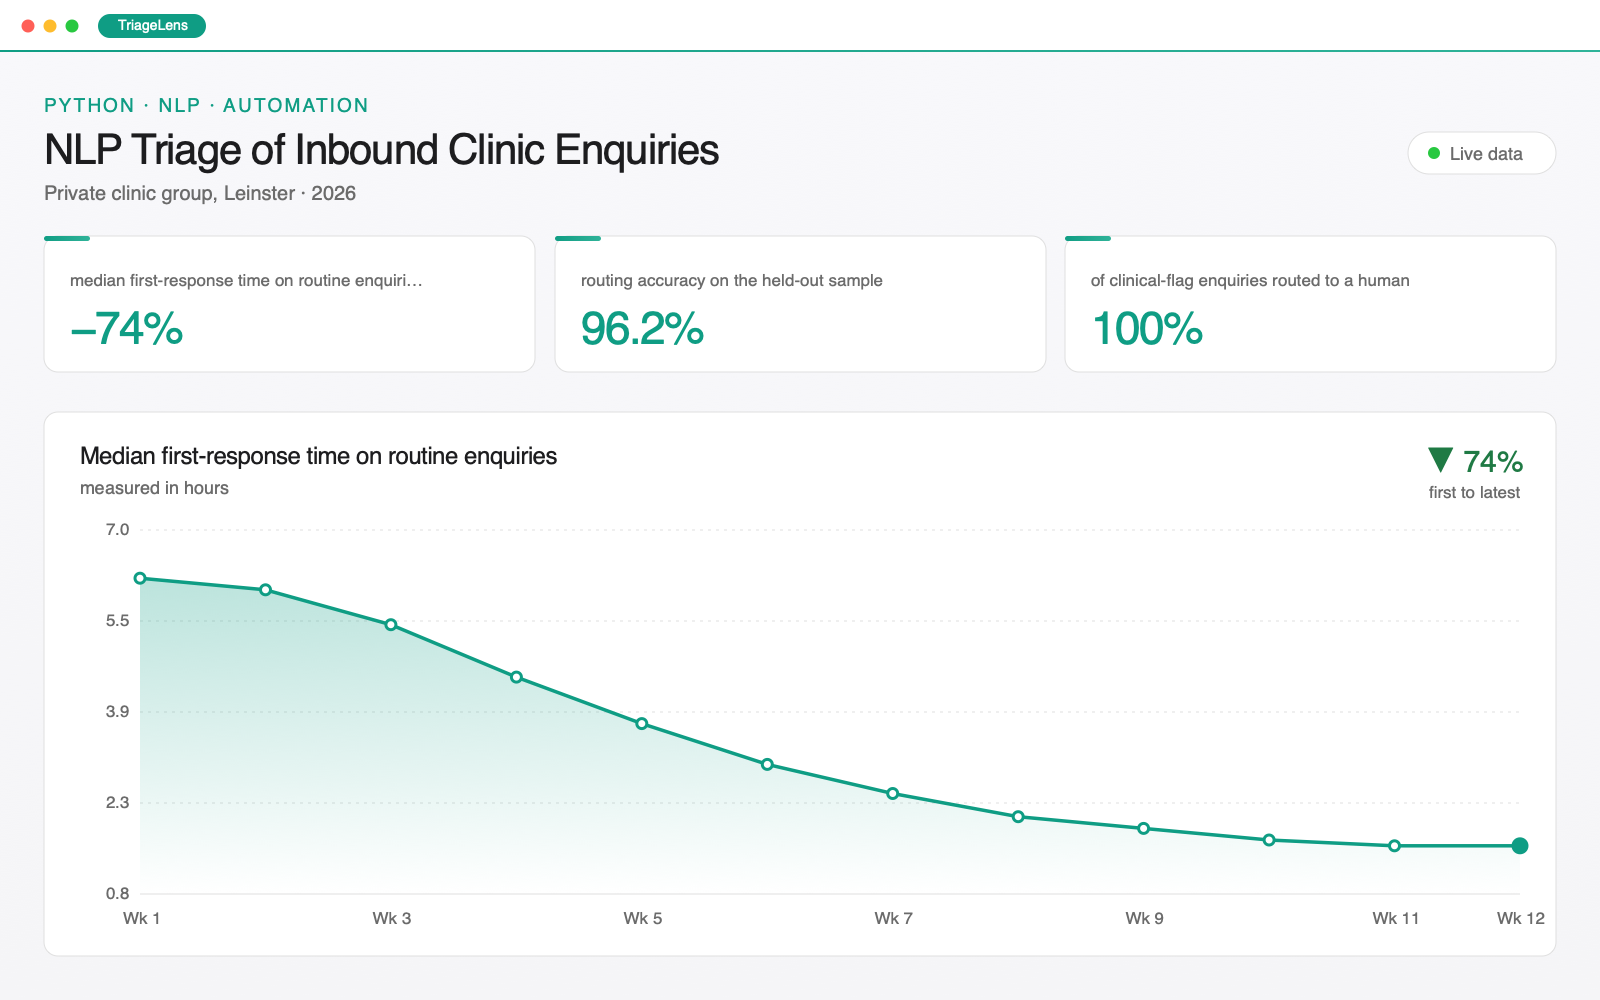
 NLP Triage of Inbound Clinic Enquiries
Classifying and routing 1,900 inbound enquiries a week, with a hard rule that anything clinical or uncertain goes to a human immediately.
- median first-response time on routine enquiries
- −74%
- routing accuracy on the held-out sample
- 96.2%
- of clinical-flag enquiries routed to a human
- 100%
- Python (spaCy, scikit-learn, sentence-transformers)
- FastAPI
- PostgreSQL
- Microsoft Graph API
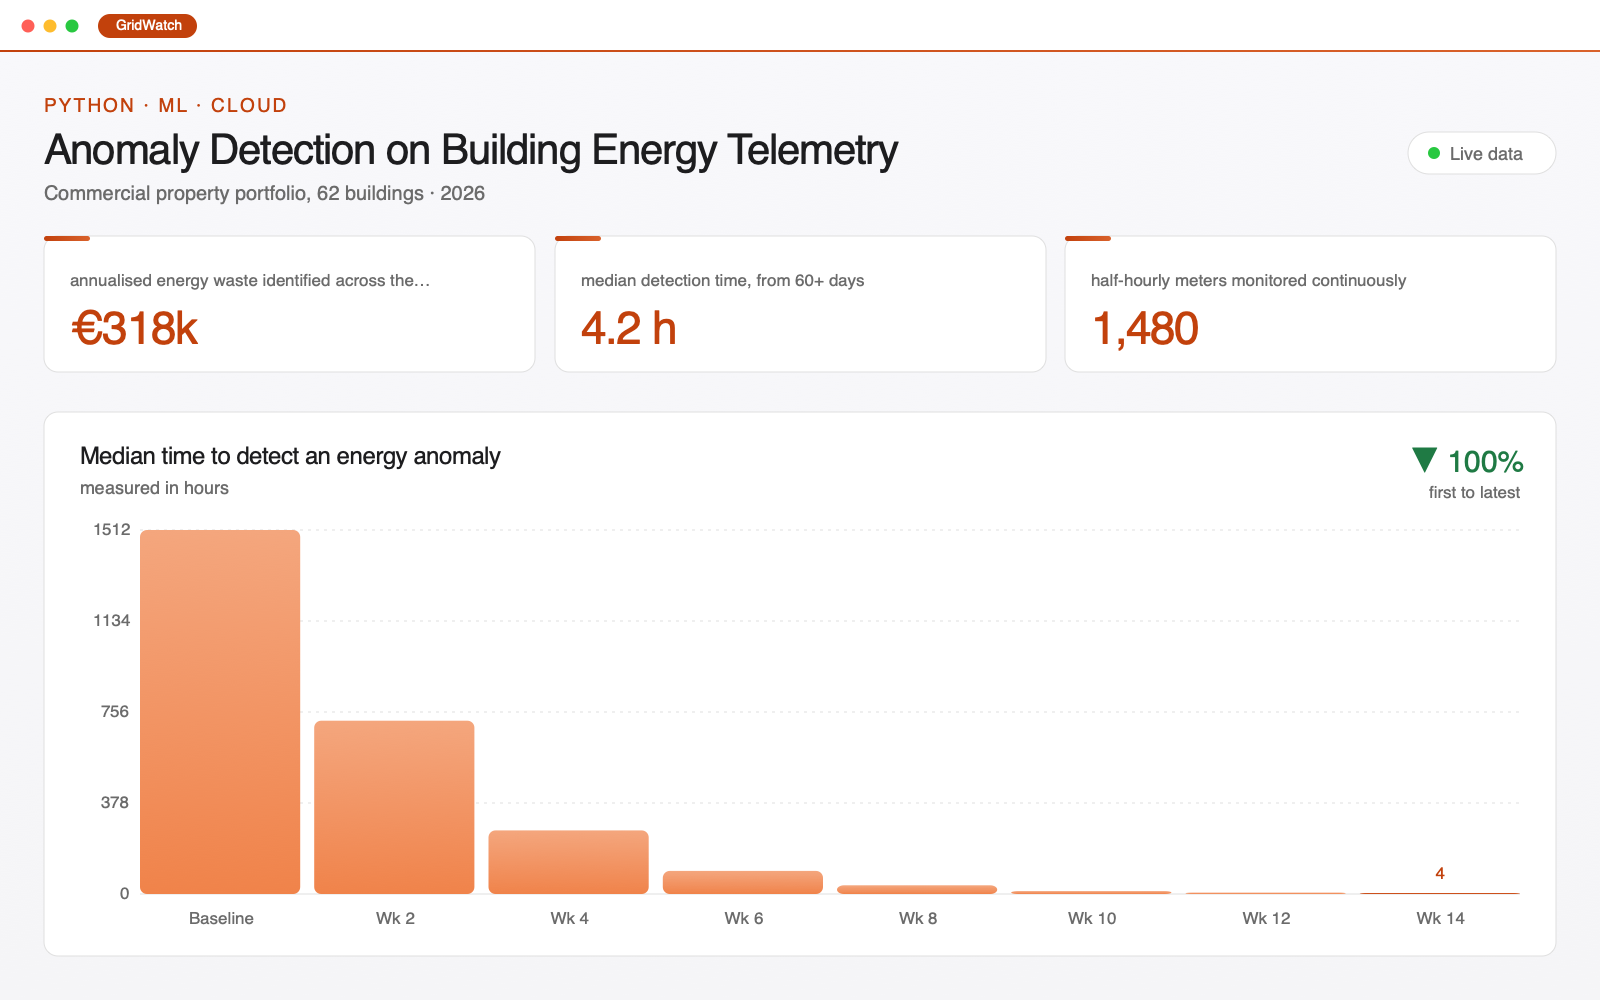 GridWatch
 Anomaly Detection on Building Energy Telemetry
Unsupervised detection across 1,480 meters that finds a failing plant item in hours instead of at the quarterly bill.
- annualised energy waste identified across the portfolio
- €318k
- median detection time, from 60+ days
- 4.2 h
- half-hourly meters monitored continuously
- 1,480
- Python (Pandas, scikit-learn, statsmodels)
- BigQuery
- Cloud Functions
- SQL
- Looker Studio
No projects match that search.
Try a tool name — Tableau, Power BI, Python, SQL — or a business problem like forecasting, churn or reporting.
Got a reporting problem that looks like one of these?
Send me the shape of it — the data you hold, the decision it should support, the deadline. You will get an honest read on scope and sequencing, and whether it is a dashboard problem or a data problem.