PYTHON · ML · POWER BI · Grocery & convenience group, Munster
ShelfPulseDemand Forecasting for an Irish Retail Group
A 34-store grocery and convenience group in Munster ordered fresh stock from last year’s sales and a manager’s judgement. Waste was running at 6.4% of fresh revenue and availability on the top hundred lines at 93%. I built a SKU-store-week forecast and wired it into the ordering sheet buyers already used.
- −31% forecast error (MAPE) versus the previous method
- €214k annualised fresh waste avoided across 34 stores
- 11.4k SKU-store-week forecasts produced every Thursday
01 — Context
The problem.
Fresh ordering was done store by store in a shared spreadsheet seeded with the same week from the previous year. It handled a normal week acceptably and everything else badly: a bank holiday, a heatwave, a competitor opening nearby or a promotion two aisles away all produced the same wrong answer. Waste sat at 6.4% of fresh revenue while availability on the top hundred lines hovered around 93%.
There was no shortage of data — four years of till-level history existed — but it had never been joined to promotions, weather or the store calendar, so none of the drivers were usable.
02 — Method
The approach.
The build, in the order it happened.
-
Built the feature history first
Four years of till data joined to the promotions calendar, Met Éireann daily observations, school and bank-holiday calendars, and each store’s own trading pattern. Every feature is computed as it would have been known on the Thursday of ordering — no leakage from the future.
-
Gradient boosting, per category
One LightGBM model per fresh category rather than one global model or one model per SKU. Categories share seasonality and promotional response; individual SKUs do not have enough history to learn it alone. A seasonal-naïve forecast was kept as the benchmark throughout.
-
Backtested on rolling origins
Twelve rolling forecast origins across two years, scored on MAPE and on waste and lost-sales cost — because a model that is symmetrically accurate is not necessarily the cheapest one to order from.
-
Delivered into the buyer’s existing sheet
The forecast lands as a suggested order quantity in the sheet buyers already opened, with a confidence band and an override box. Overrides are logged and fed back into the next review — the model earns trust rather than demanding it.
03 — Outcome
What changed.
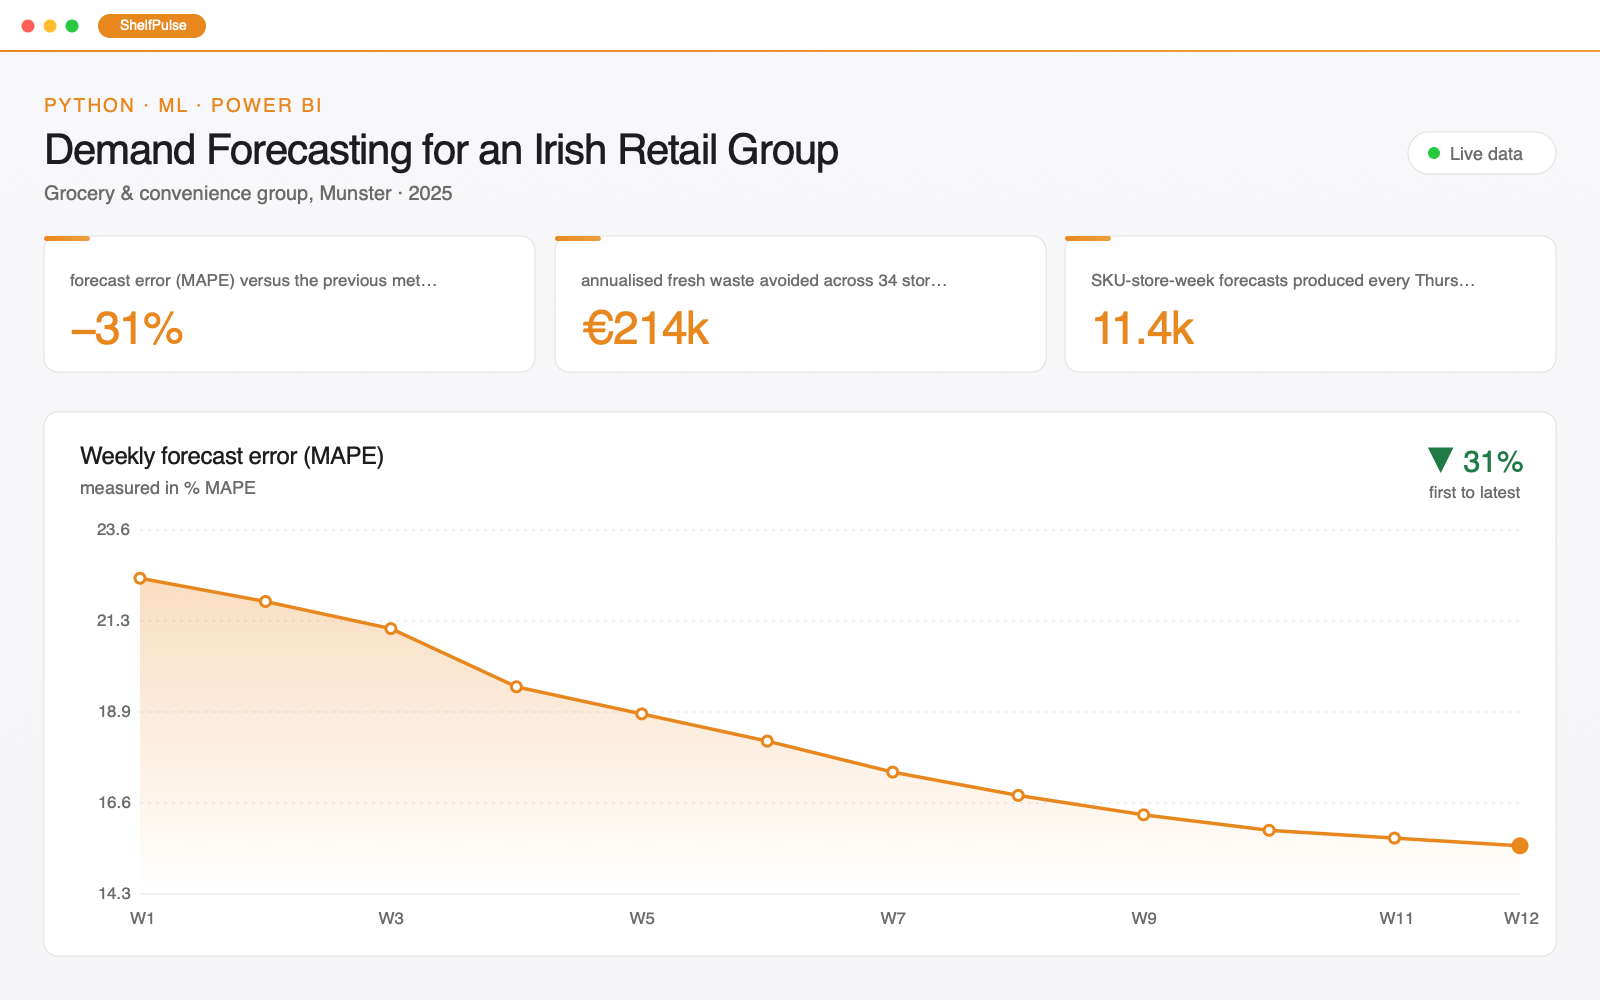
- Weekly forecast error fell from 22.4% to 15.5% MAPE, a 31% relative improvement over the previous-year method, and held through two bank-holiday weeks.
- Fresh waste dropped from 6.4% to 4.1% of fresh revenue — around €214k avoided on an annualised basis across the estate.
- Availability on the top hundred lines rose from 93.1% to 97.6%.
- Buyer overrides settled at 8% of lines by week ten, down from 41% in the first fortnight.
04 — The numbers
Weekly forecast error (MAPE).
Tracked as % MAPE, from W1 through W12 — low 15.5, high 22.4.
05 — Screens
What it looks like in use.
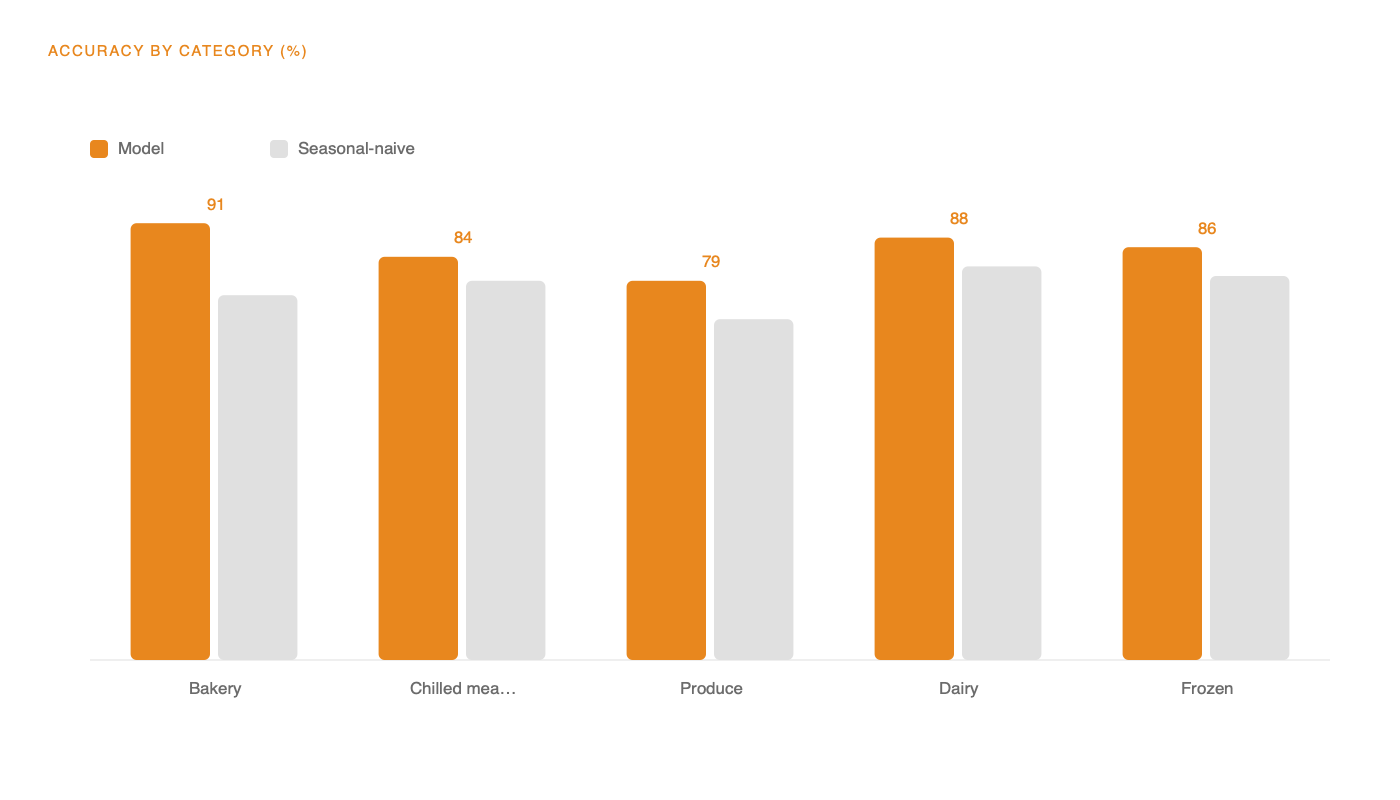
Accuracy by category against the seasonal-naïve benchmark. Bakery gained most; loose produce needed a separate weather feature.
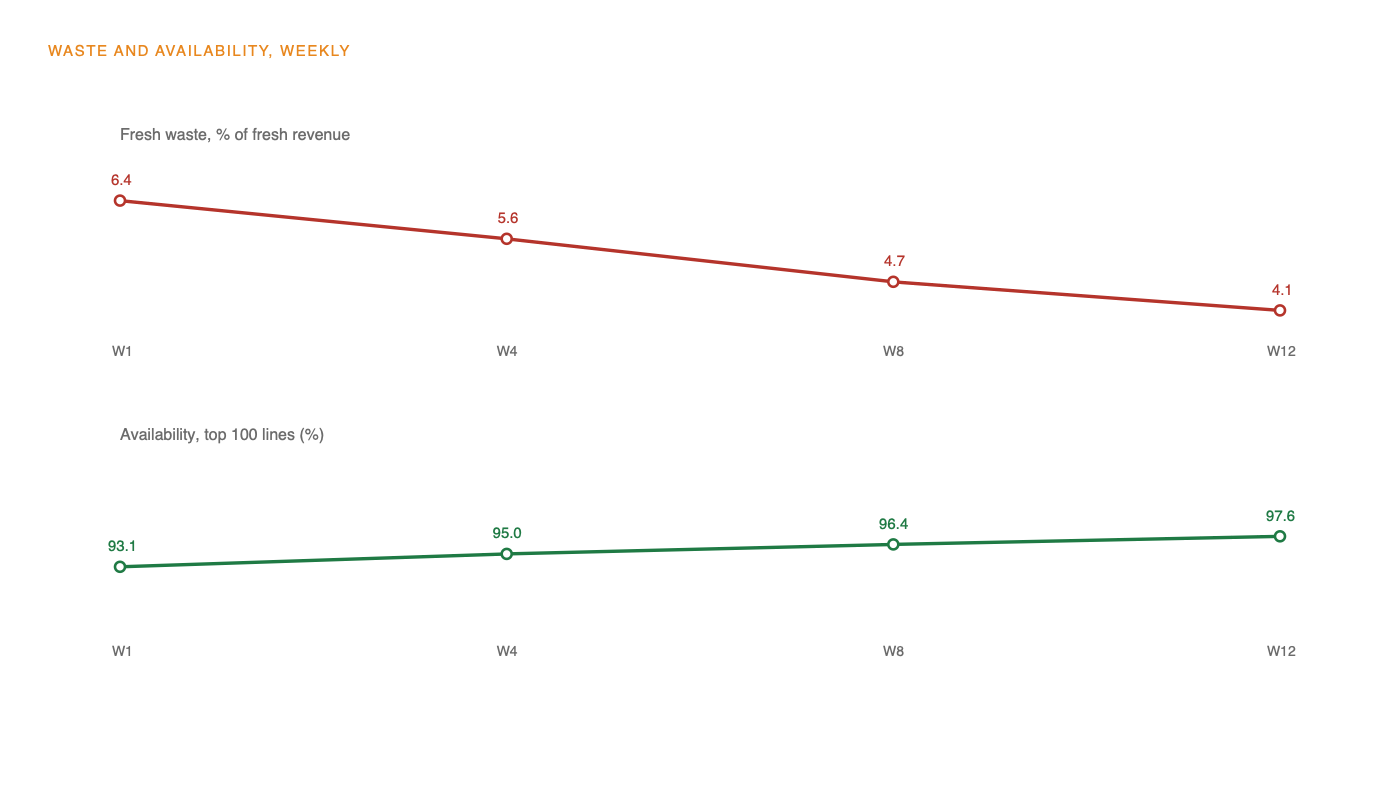
The weekly review page — waste and availability side by side, because improving one at the other’s expense is easy and pointless.
06 — Stack & role
Built with.
- Python (Pandas, scikit-learn, LightGBM)
- SQL
- Power BI
- Azure Blob Storage
- Excel
- Role
- Lead analyst — modelling, pipeline and buyer rollout
- Duration
- 14 weeks
- Client
- Grocery & convenience group, Munster
- Period
- 2025
07 — Questions
The questions I get asked about this one.
Most fresh SKUs have too little clean history to learn seasonality or promotional lift on their own. Pooling within a category gives the model enough signal while keeping the response curves meaningfully different between, say, bakery and chilled meats.
As explicit features — mechanic, depth, position in the leaflet and whether a substitute line is also on promotion. Cannibalisation between neighbouring lines was the single biggest accuracy gain after weather.
The confidence band widens and the sheet flags the line for a human decision. A forecast that knows it is uncertain is far more useful to a buyer than one that does not.