POWER BI · SQL · CLOUD · 3PL operator, Cork & Rotterdam
RouteWatch IllustrativeLive Logistics Control Tower
Customers were the exception-detection system at a third-party logistics operator running 2,300 consignments a week out of Cork and Rotterdam, across four carrier systems that knew nothing of each other. I built a control tower that ingests all four feeds, reconciles them onto one consignment spine and puts the exceptions on a screen the operations floor actually watches.
This is an anonymised, illustrative scenario — representative of the shape of engagement and the way I work, not a named client or a delivered set of results. The real, named work on this site is labelled as such.
- +9.4pp on-time-in-full delivery over two quarters
- 4 → 1 carrier systems reconciled onto one consignment spine
- 11 min data latency, against a previous 24-hour lag
Value returned
+9.4pp
On-time-in-full delivery
88.9% to 98.3% over two quarters, on a reconciled measure rather than carrier self-reporting.
Time returned
10h
Operations hours returned each week
The daily bridging spreadsheet is no longer rebuilt by hand.
Effort invested
10 weeks
Effort to build
Consulting analyst — data model, ingestion, dashboard and floor rollout.
Quality
11 min
End-to-end data latency
Against a previous 24-hour spreadsheet cycle, so a stuck consignment surfaces the same shift.

01 — Context
The problem.
Four carriers, four portals, four different status vocabularies and four different ideas of what a delivery date means. Operations kept a spreadsheet to bridge them, rebuilt once a day, which meant a consignment could sit stuck for 20 hours before anyone noticed. On-time-in-full was reported at 88.9% but calculated from carrier self-reporting, so nobody quite trusted it.
The commercial cost was concentrated in a small number of lanes and a small number of accounts — but with the data fragmented, nobody could prove which.
02 — Method
The approach.
The build, in the order it happened.
-
One consignment spine
A single conforming table keyed on the internal consignment ID, with carrier references as attributes. Every carrier’s status vocabulary maps into one nine-state model agreed with the ops managers, and unmappable statuses raise an alert instead of defaulting to “in transit”.
-
Incremental ingestion every ten minutes
Azure Data Factory pulls each carrier feed on a ten-minute cadence with watermark-based incremental loads and a dead-letter table for rows that fail validation. Two of the four had no API, so those are driven by a scheduled Python job against their export endpoint.
-
Exceptions defined by dwell, not by status
A consignment is an exception when it has sat in one state longer than that lane’s 90th-percentile dwell time — so the definition adapts per lane rather than assuming a Rotterdam trunk behaves like a Cork city delivery.
-
Built for a wall, then for a desk
The primary view is a floor display: exception count, worst lanes, oldest consignment. The analytical drill-down for account reviews sits behind it, sharing exactly the same measures.
03 — Outcome
What changed.
- On-time-in-full rose from 88.9% to 98.3% over two quarters — the first reconciled week came out level with the carrier-reported baseline, so the gain is not an artefact of the new measure.
- Data latency fell from a 24-hour spreadsheet cycle to 11 minutes end to end.
- Two lanes were shown to generate 61% of all exceptions; renegotiating one carrier’s cut-off time removed most of them.
- Customer-raised exception queries fell by roughly half, because operations now make the call first.
04 — Before & after
The same measures, either side of the work.
Each pair is scaled against its own larger value, so the comparison is honest rather than flattering.
On-time-in-full delivery
+10.6%- Before
- 88.9 %
- After
- 98.3 %
End-to-end data latency
−99.2%- Before
- 1440 minutes
- After
- 11 minutes
Carrier systems to reconcile by hand
−75%- Before
- 4 systems
- After
- 1 systems
05 — The numbers
On-time-in-full delivery.
Tracked as % OTIF, from Wk 1 through Wk 19 — low 88.9, high 98.3.
06 — Screens
What it looks like in use.
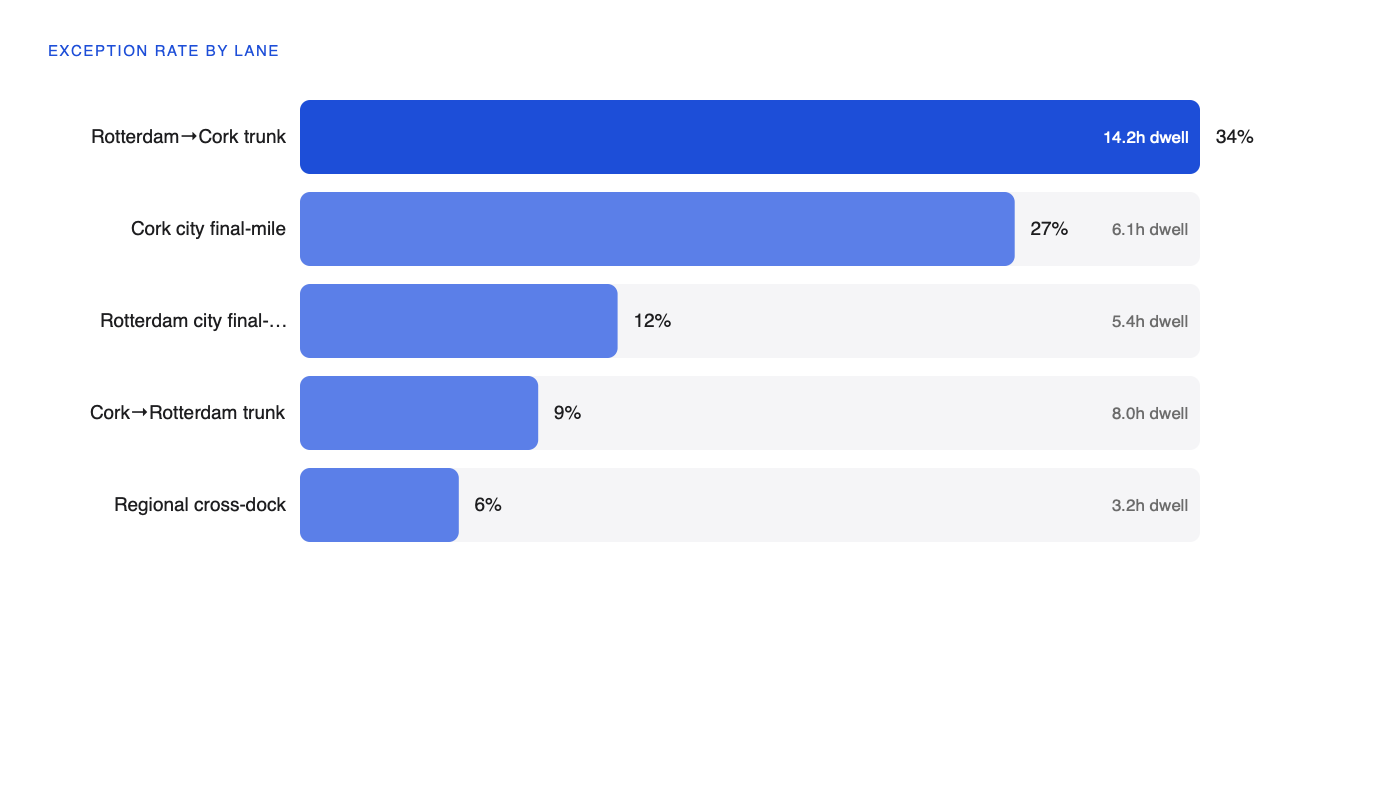
Lane performance. Two lanes accounted for 61% of exceptions — invisible while the data sat in four portals.
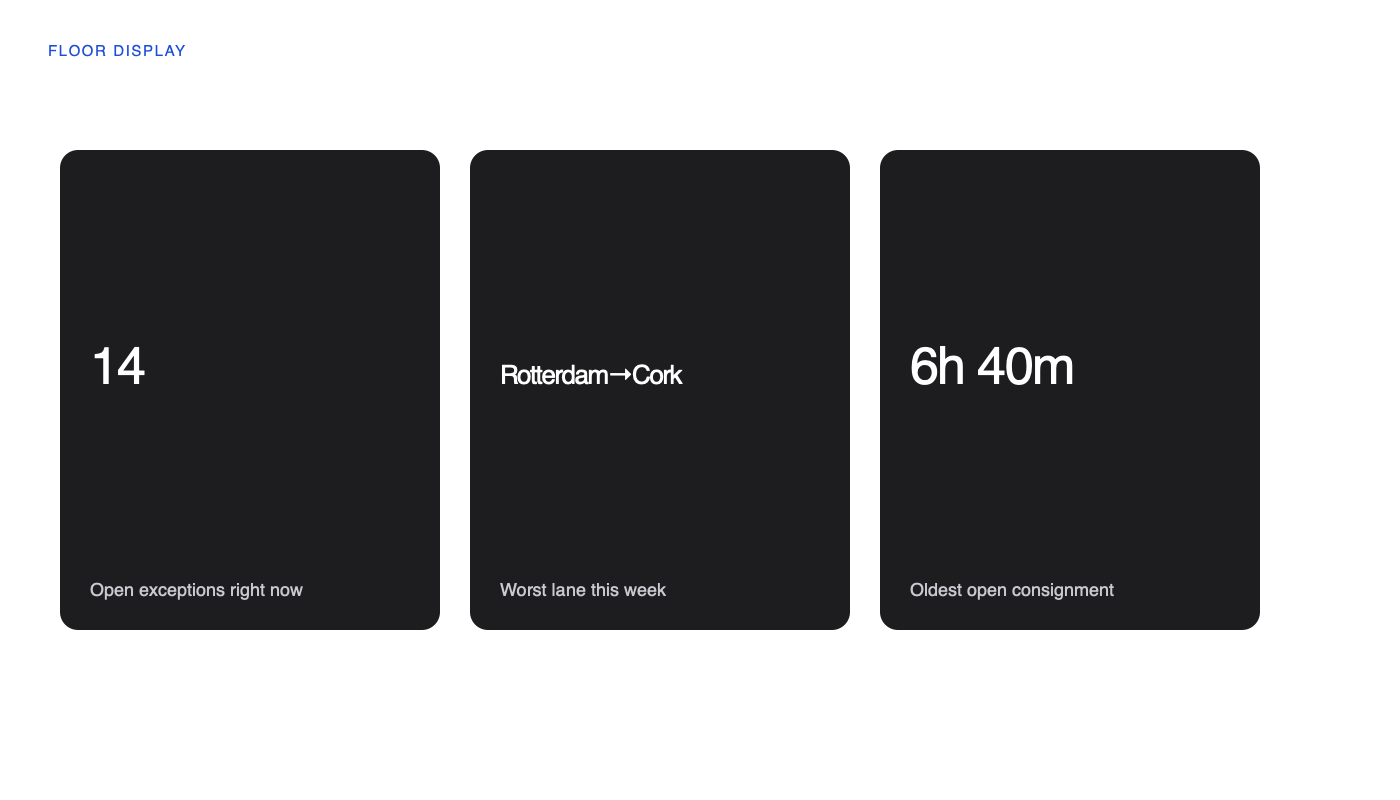
The floor display. Three numbers, readable from across the room, refreshing every ten minutes.
07 — Stack & role
Built with.
- Power BI
- SQL Server
- Azure Data Factory
- Azure SQL
- Python
- Role
- Consulting analyst — data model, ingestion, dashboard, floor rollout
- Duration
- 10 weeks
- Client
- 3PL operator, Cork & Rotterdam
- Period
- 2026
08 — Questions
The questions I get asked about this one.
Two of the four carriers only publish updates in batches anyway, so sub-minute polling would have bought latency the source data does not have. Ten minutes is comfortably inside the window in which an operator can still act.
It lands in the dead-letter table and raises an alert. Defaulting an unknown status to “in transit” is how a stuck consignment stays invisible, so the model refuses to guess.